Into which categories can the users be identified to?
Now is time to help your supermarket get closer and closer to you...
Once the analysis on the different beer styles carried out and the beers gathered into supra styles, it's time to apply a similar process to the users. Indeed, remember that our team promised the supermarket to help it reorganise it's beers' shelves according to the different beers' styles but also depending on the types of beers' consumers the clients are. Thus, for lack of being able to implement a predictive model which recommends a specific beer to each user because of the unsufficient personal information about the users, we thought it could be interesting to give the customers the opportunity to identify themselves to certain categories of beers' consumer to helping them in their choice of the most adequate beer.
In order to build these categories and let people identify themselves before choosing their beer, we have to rely on some information about people. And the best thing for that is to use the users.csv dataset from BeerAdvocate which in a way represents a sample of all beer consumers' taste in the world. From there, we thought it could be relevant to help the supermarket clients to identify themselves to one of these categories:
- Experienced beer consumers: For the ones familiar with beers and which consider themselves as regular consumers.
- Novice beer consumers: For those less accustomed to beer consumption and which are willing to discover this tasty beverage.
- Explorator: For those who want to rediscover beer and trying something new.
- Nationalist: For the ones who always support their country and only want to taste their local beers
But is there a real correlation between the users experience and their taste?
Having a very large number of users in our dataset, it is likely that some users might resemble each other. The only information we have about a certain user are his ratings and his birth-country. The birth country is likely to influence a user’s ratings, since a user will probably rate beers from his own country, or in the surrounding countries. The number of ratings of a user indicates a certain level of experience. In fact, users having rated more than 100 different beers might have a different palate than a user having rated less than 10 beers for example. Thus, to determine whether it is relevant to categorize users based on these 2 features, we conducted a few analyses.
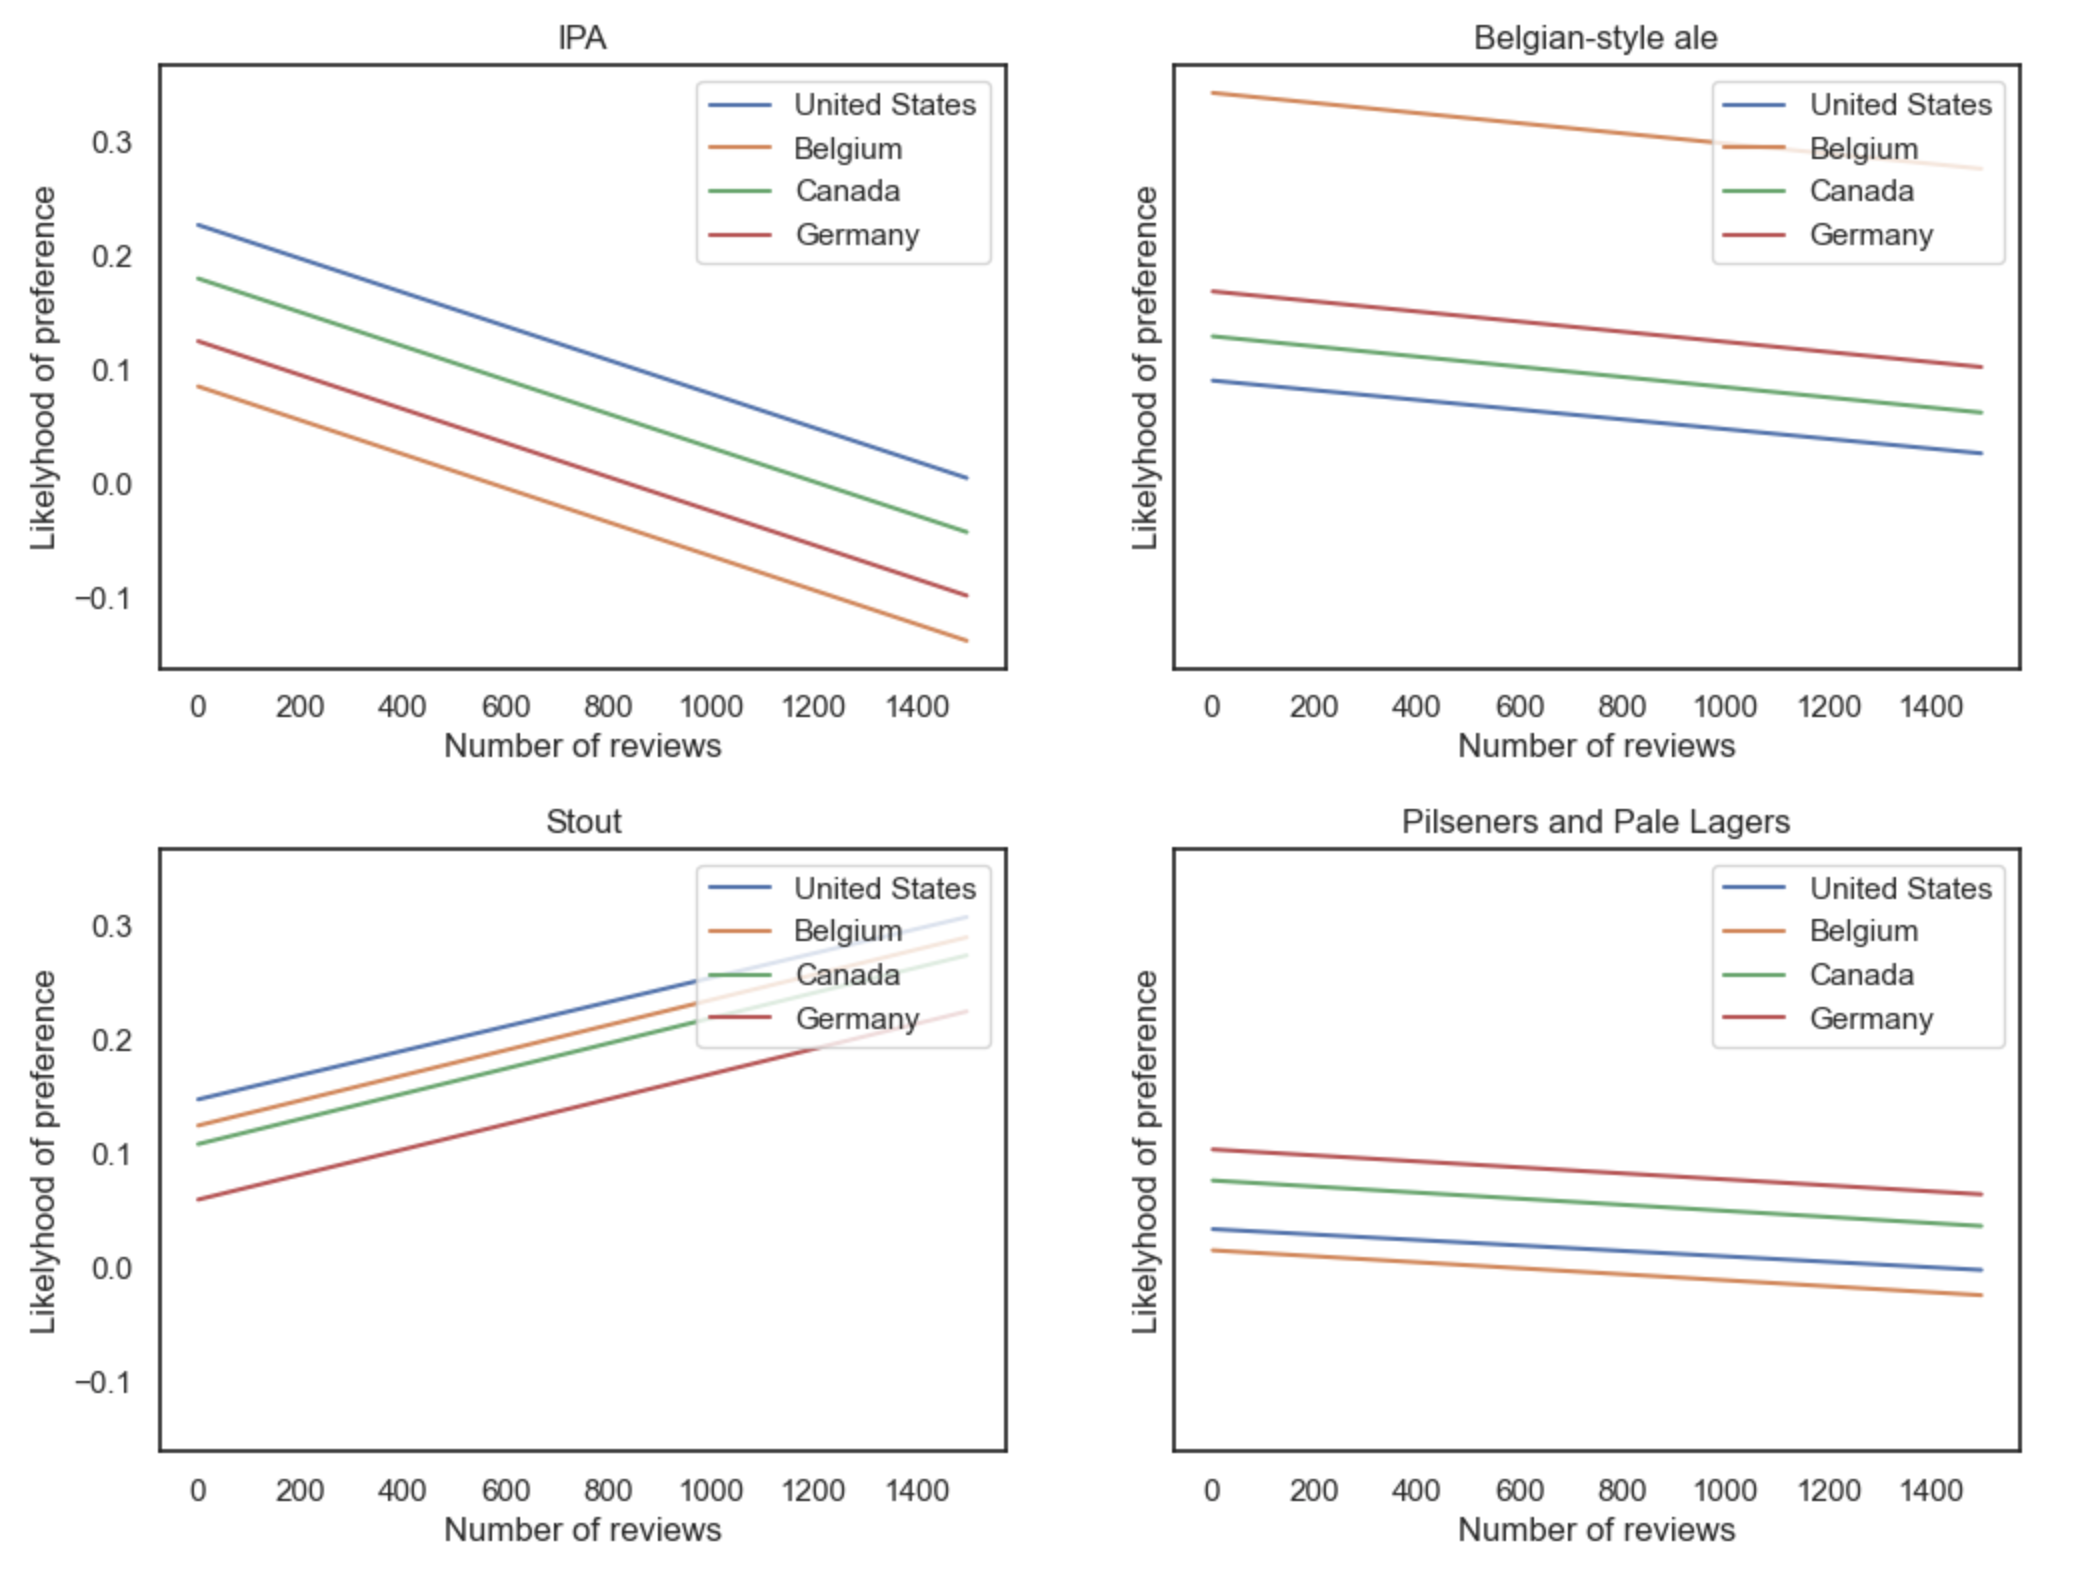
First, for each user a “favorite style” was determined based on a user’s top-rated beers. We then use a regression analysis to predict the likelihood that a certain beer style will be a user favorite based on his country of origin and number of ratings. The figure bellow shows the regression analyses for four different styles (IPA’s, Belgian-style ales, Stouts and Pilseners) in four different countries (United States, Canada, Belgium and Germany). We can see for example that a user from the United States or Canada is more likely to prefer IPA’s than a user from Germany or Belgium. However, a user from Belgium is much more likely than any of the three other countries to prefer Belgian-style ales. We also notice that the probability of a user to prefer IPA’s decreases with the number of ratings, while stouts are more appreciated by experienced users than novice users. From these observations we can conclude that the preferences of a user are likely to depend on his country of origin and on his level of experience. In fact, users tend to rate mostly beers from their own country. Thus, they are more likely prefer beer styles that are brewed in their country. Moreover, a user’s whim is likely to evolve the more beers he tries. Our observations are consistent with these facts.
Experience and country of birth are therefore 2 seemingly valid criteria to separate users into categories. However, for user experience, we must choose a threshold for the number of ratings that separates “experienced users” from “non-experienced users”.
Let's now categorise the users
First of all, in order to categorise the users according to their level of experience, it is eseential to analyse the distribution of the number of ratings from our users' dataset. Hence, the number of ratings gives a idea of the contribution of each user and therefore also an idea about how many beers each one actually tasted. Note that this category deals with the level of experience, and not the level of expertise (expert or not) which would depend on the rates actually given which are much more subjective and therefore not that reliable.
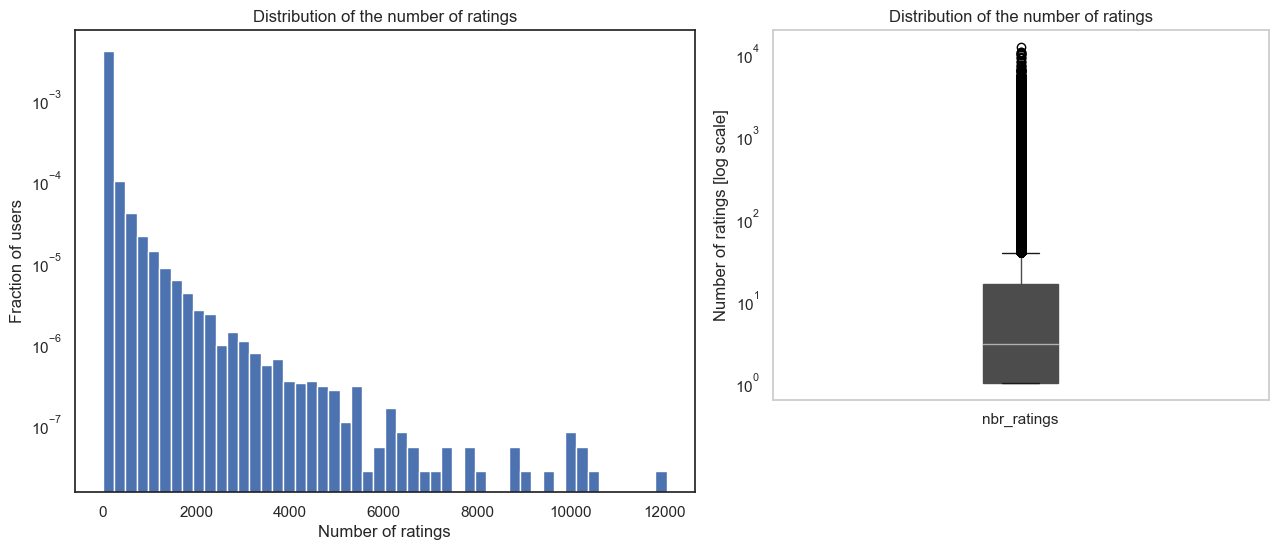
From the box plot we have that:
- Min: 1 rating
- Q1(25% of users): 1 rating
- Median(50% of users): 3 ratings
- Q3(75% of users): 16 ratings
- Max: 12046 ratings
In view of the distribution of the number of ratings for the different users, we consider that a user is categorised as an experienced beer consummer if he's considered as outlier when visualizing the ratings distribution using the boxplot. Hence, all users with number of ratings outside 1.5 times the interquartile range above the upper quartile are considered as experienced. Therefore, the experienced threshold is set at Q3 + 1.5 * IQR = Q3 + 1.5 * (Q3-Q1) = 16+1.5 * (16-1) = 39. Thus, all users which will have rated more than 39 beers are part of the experienced beer consumers category which represents 15.81% of the total number of users in the dataset. Similarly to the experienced users, all users with number of ratings below the median which is set at 3 ratings are considered as novice beer consumers.
On the other hand, a user is considered as explorator if he tends to rate beers that are not that popular. Thus, similarly to the level of experience, and once the numbe rof ratigns for each beer implmented, we can analyse the distribution of the number of ratings to deduce a threshold.
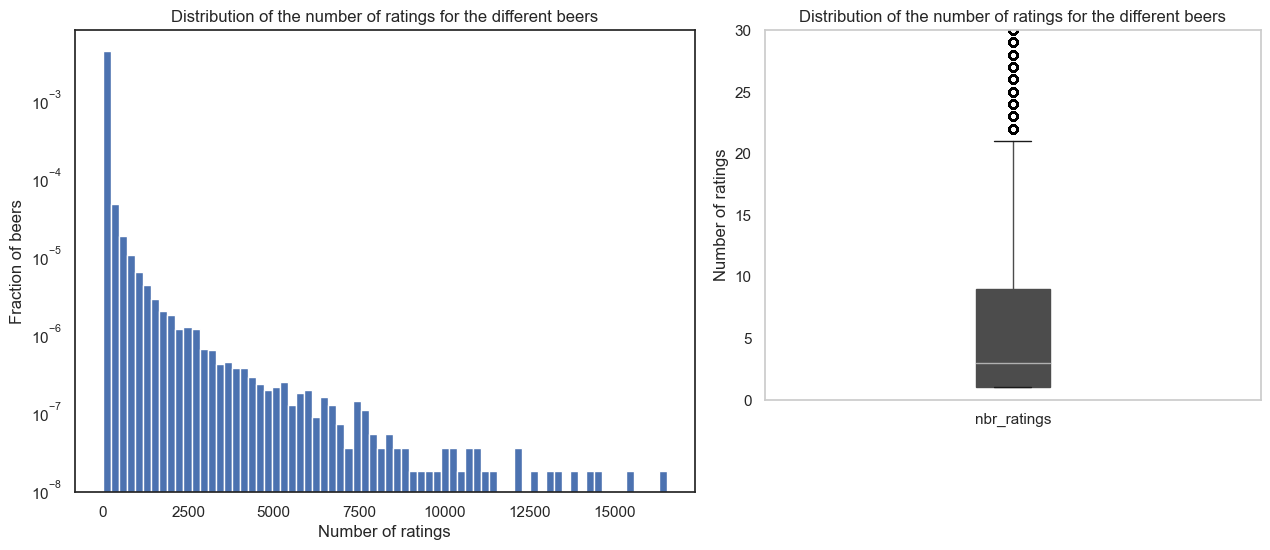
From the box plot, this gives us :
- Min: 1 rating
- Q1(25% of beers): 1 rating
- Median(50% of beers): 3 ratings
- Q3(75% of beers): 9 ratings
- Max: 16509 ratings
In view of the distribution of the the number of ratings per beer, one notices the heavy-tail of the distribution. Thus, almost 75% of the beers have less than 10 ratings which is already almost half of the number of ratings than the least popular beer among all the most rated beers. Thereforen a bit arbitrarly, we consider all beers with under 10 ratings as 'scarce beers'. Thus, if a user has rated one of these beers, he's considered as an explorator.
Finally, based on the thresholds set right above, the users can be categorised into the different categories. For a better visualisation of the results, the interactive map below will give you an insight about how are the categories represnted in some of the most important countries in the dataset.