Finding the favorite supra-styles for each category of users
Now that we have the user categories, we want to determine the favorite supra-styles for each category of user, for each country to find the beers that will be displayed on the supermarket shelves.
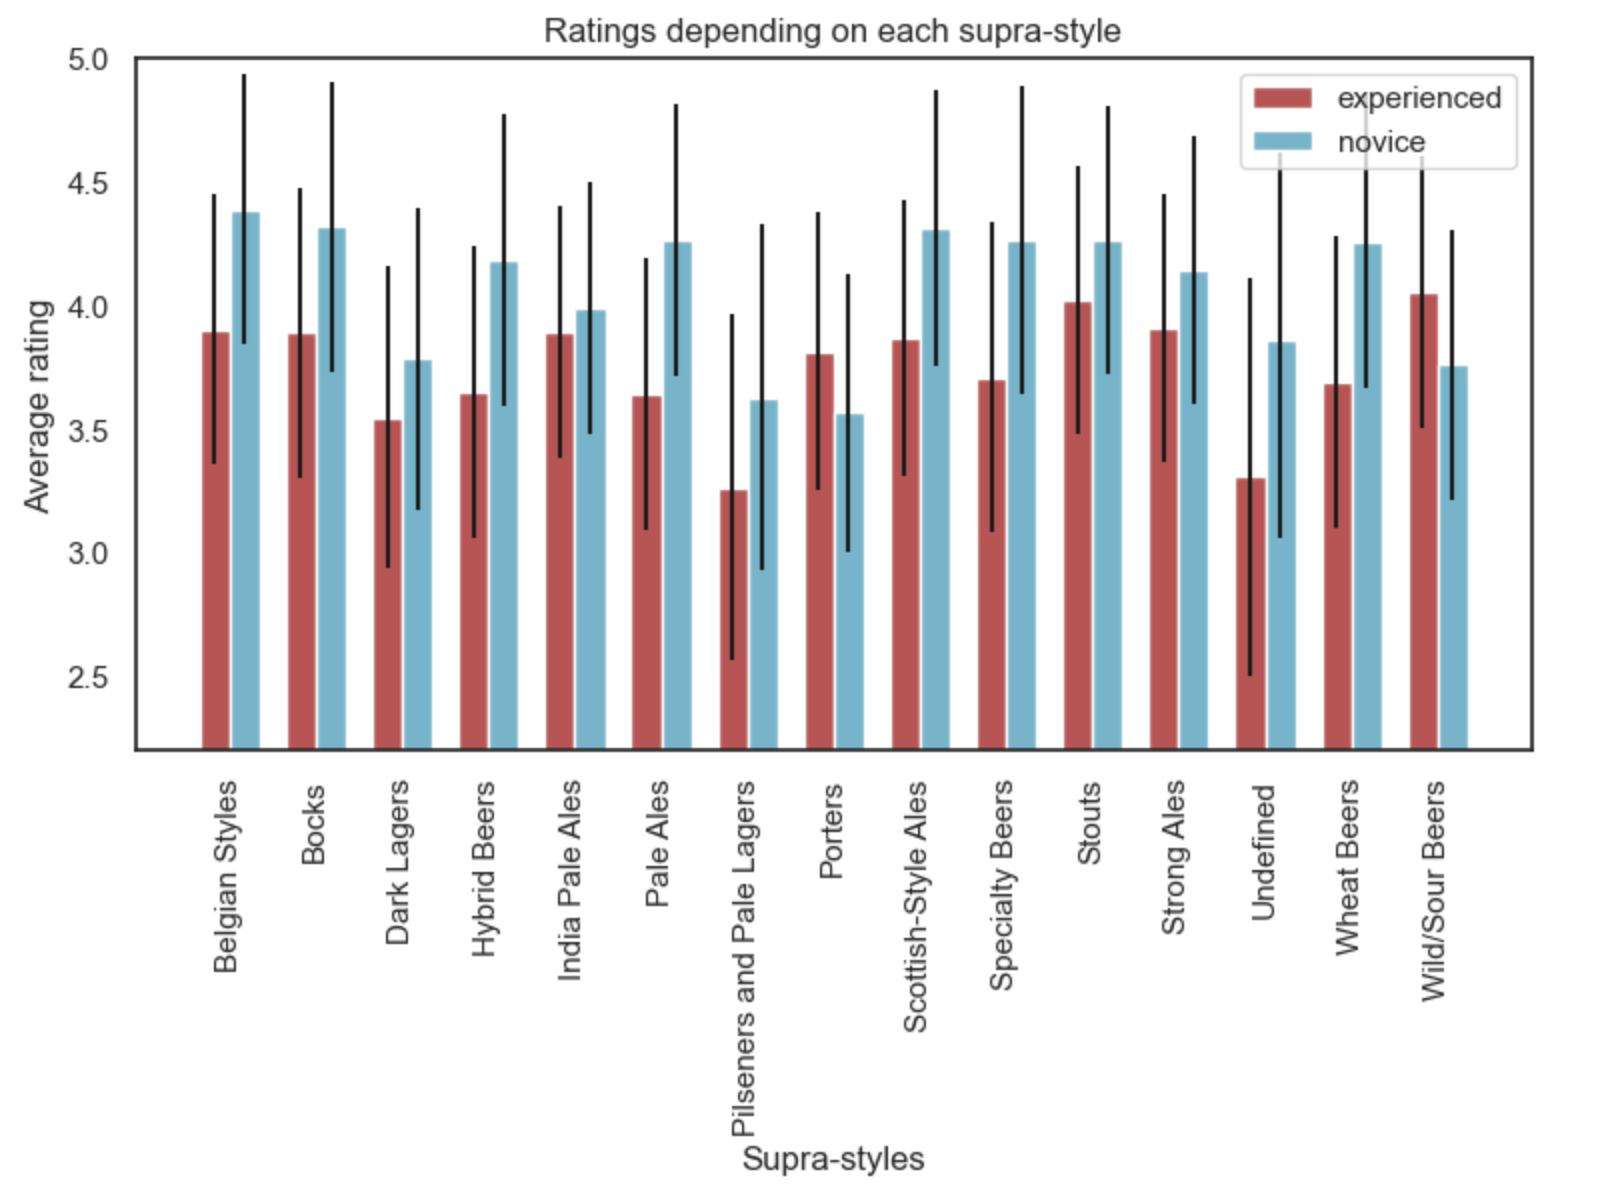
As an example, we will compare the ratings for experienced and novice German users and respectively sort out their favorite supra-styles. The graph below illustrates the mean ratings of each supra-style for the two categories of German users. We observe that the mean ratings of experienced users are lower than the novice users on average. This could be explained by the fact that more experienced users tend to give “harsher” ratings than novice users. We also notice differences in terms of preferences, which is consistent with our previous analysis. In fact, novice German users tend to prefer Belgian-style ales, Bocks and Scottish-style ales, while experienced users are more inclined towards Wild/Sour beers, Stouts and Strong Ales.
Now, from the preferred styles for each category of users, we need to determine which beers we will place on the shelves of the supermarket, which brings us to our final task.
Finding the best beers to place on the shelves
The final step before placing the beers on the shelves is to determine which beers will be selected for each category.
As a first approach, we thought of doing a Bayesian regression to predict the rating of a beer based on its features for each user category, and discard ratings that were too far from the prediction. However, the results from the Bayesian regression turned out to be inconclusive. In fact, we have very few features for each beer (country, abv and style), and the fact that the regression is linear is very limiting (e.g., the ratings would increase/decrease with abv which ranges from 0% to 40%, thus the predicted rating did not make sense!). Therefore, decided to take a different approach.
As a second approach, we decided to pick a threshold for the minimal number of ratings of a beer such that we consider it for the selection. From previous analyses we found that the median of the number of ratings for a beer is 3 ratings and the 3rd quantile is 9 ratings. Thus, we pick a threshold of 9 ratings minimum for a beer. From the remaining beers we pick the top beers for each category of users based on the ratings.